Designing Better Dashboards
A public webinar on making dashboards that are aesthetically pleasing as well as clear.
Open to design leadership roles
Currently working as an Associate Principal of Design at NeenOpal, leading teams across design, content and UI. I build organizational design, make consequential product decisions, operate within cross-functional teams, and build systems that scale beyond themselves.
Tools I use daily
Figma, Power BI, Tableau, Google Analytics 4, Google Ads, Adobe Illustrator, Adobe Photoshop, Adobe Premiere Pro, Adobe After Effects, Framer, Webflow
About
I've spent most of my design career working on simplifying complex subject matter into aesthetic designs and interfaces. I've worked across data analytics, communication design, and technical products.
I started by solving those problems through visual design. Over time, that grew into designing products, shaping how teams work, and eventually setting teams up to solve those problems themselves.
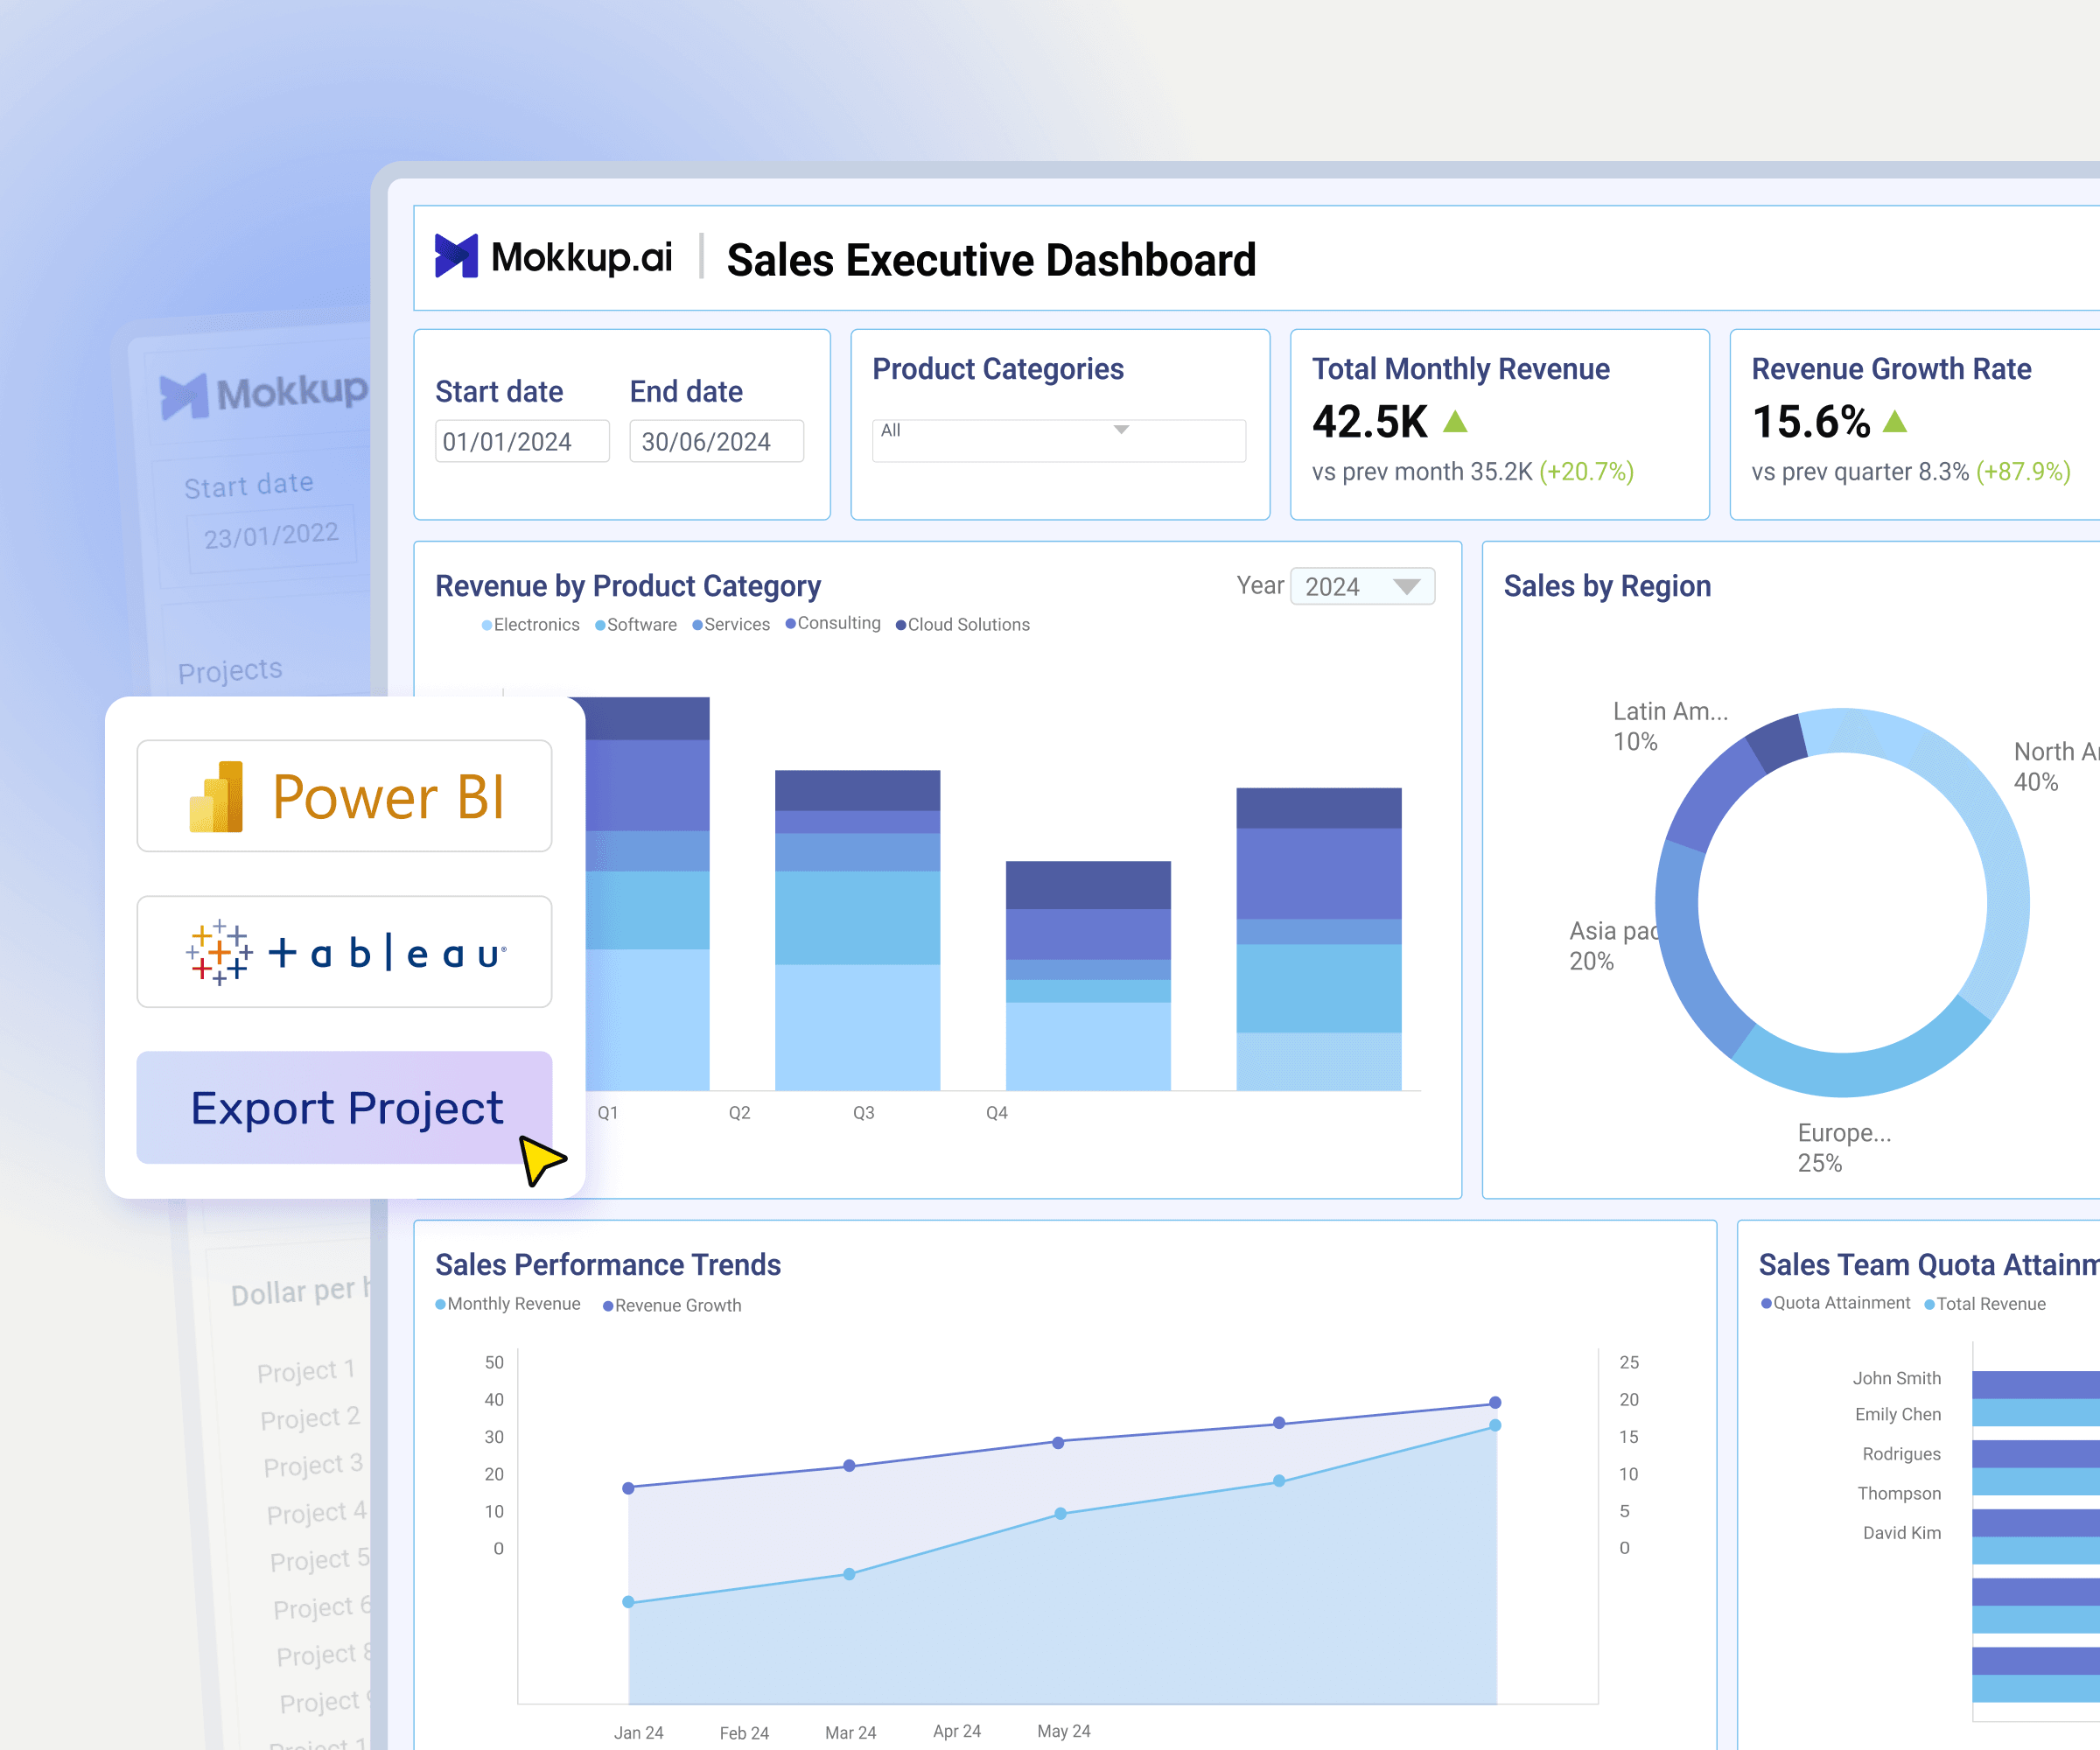
Founding design lead on an AI dashboard wireframing tool for data analysts, with one-click export to Power BI and Tableau.
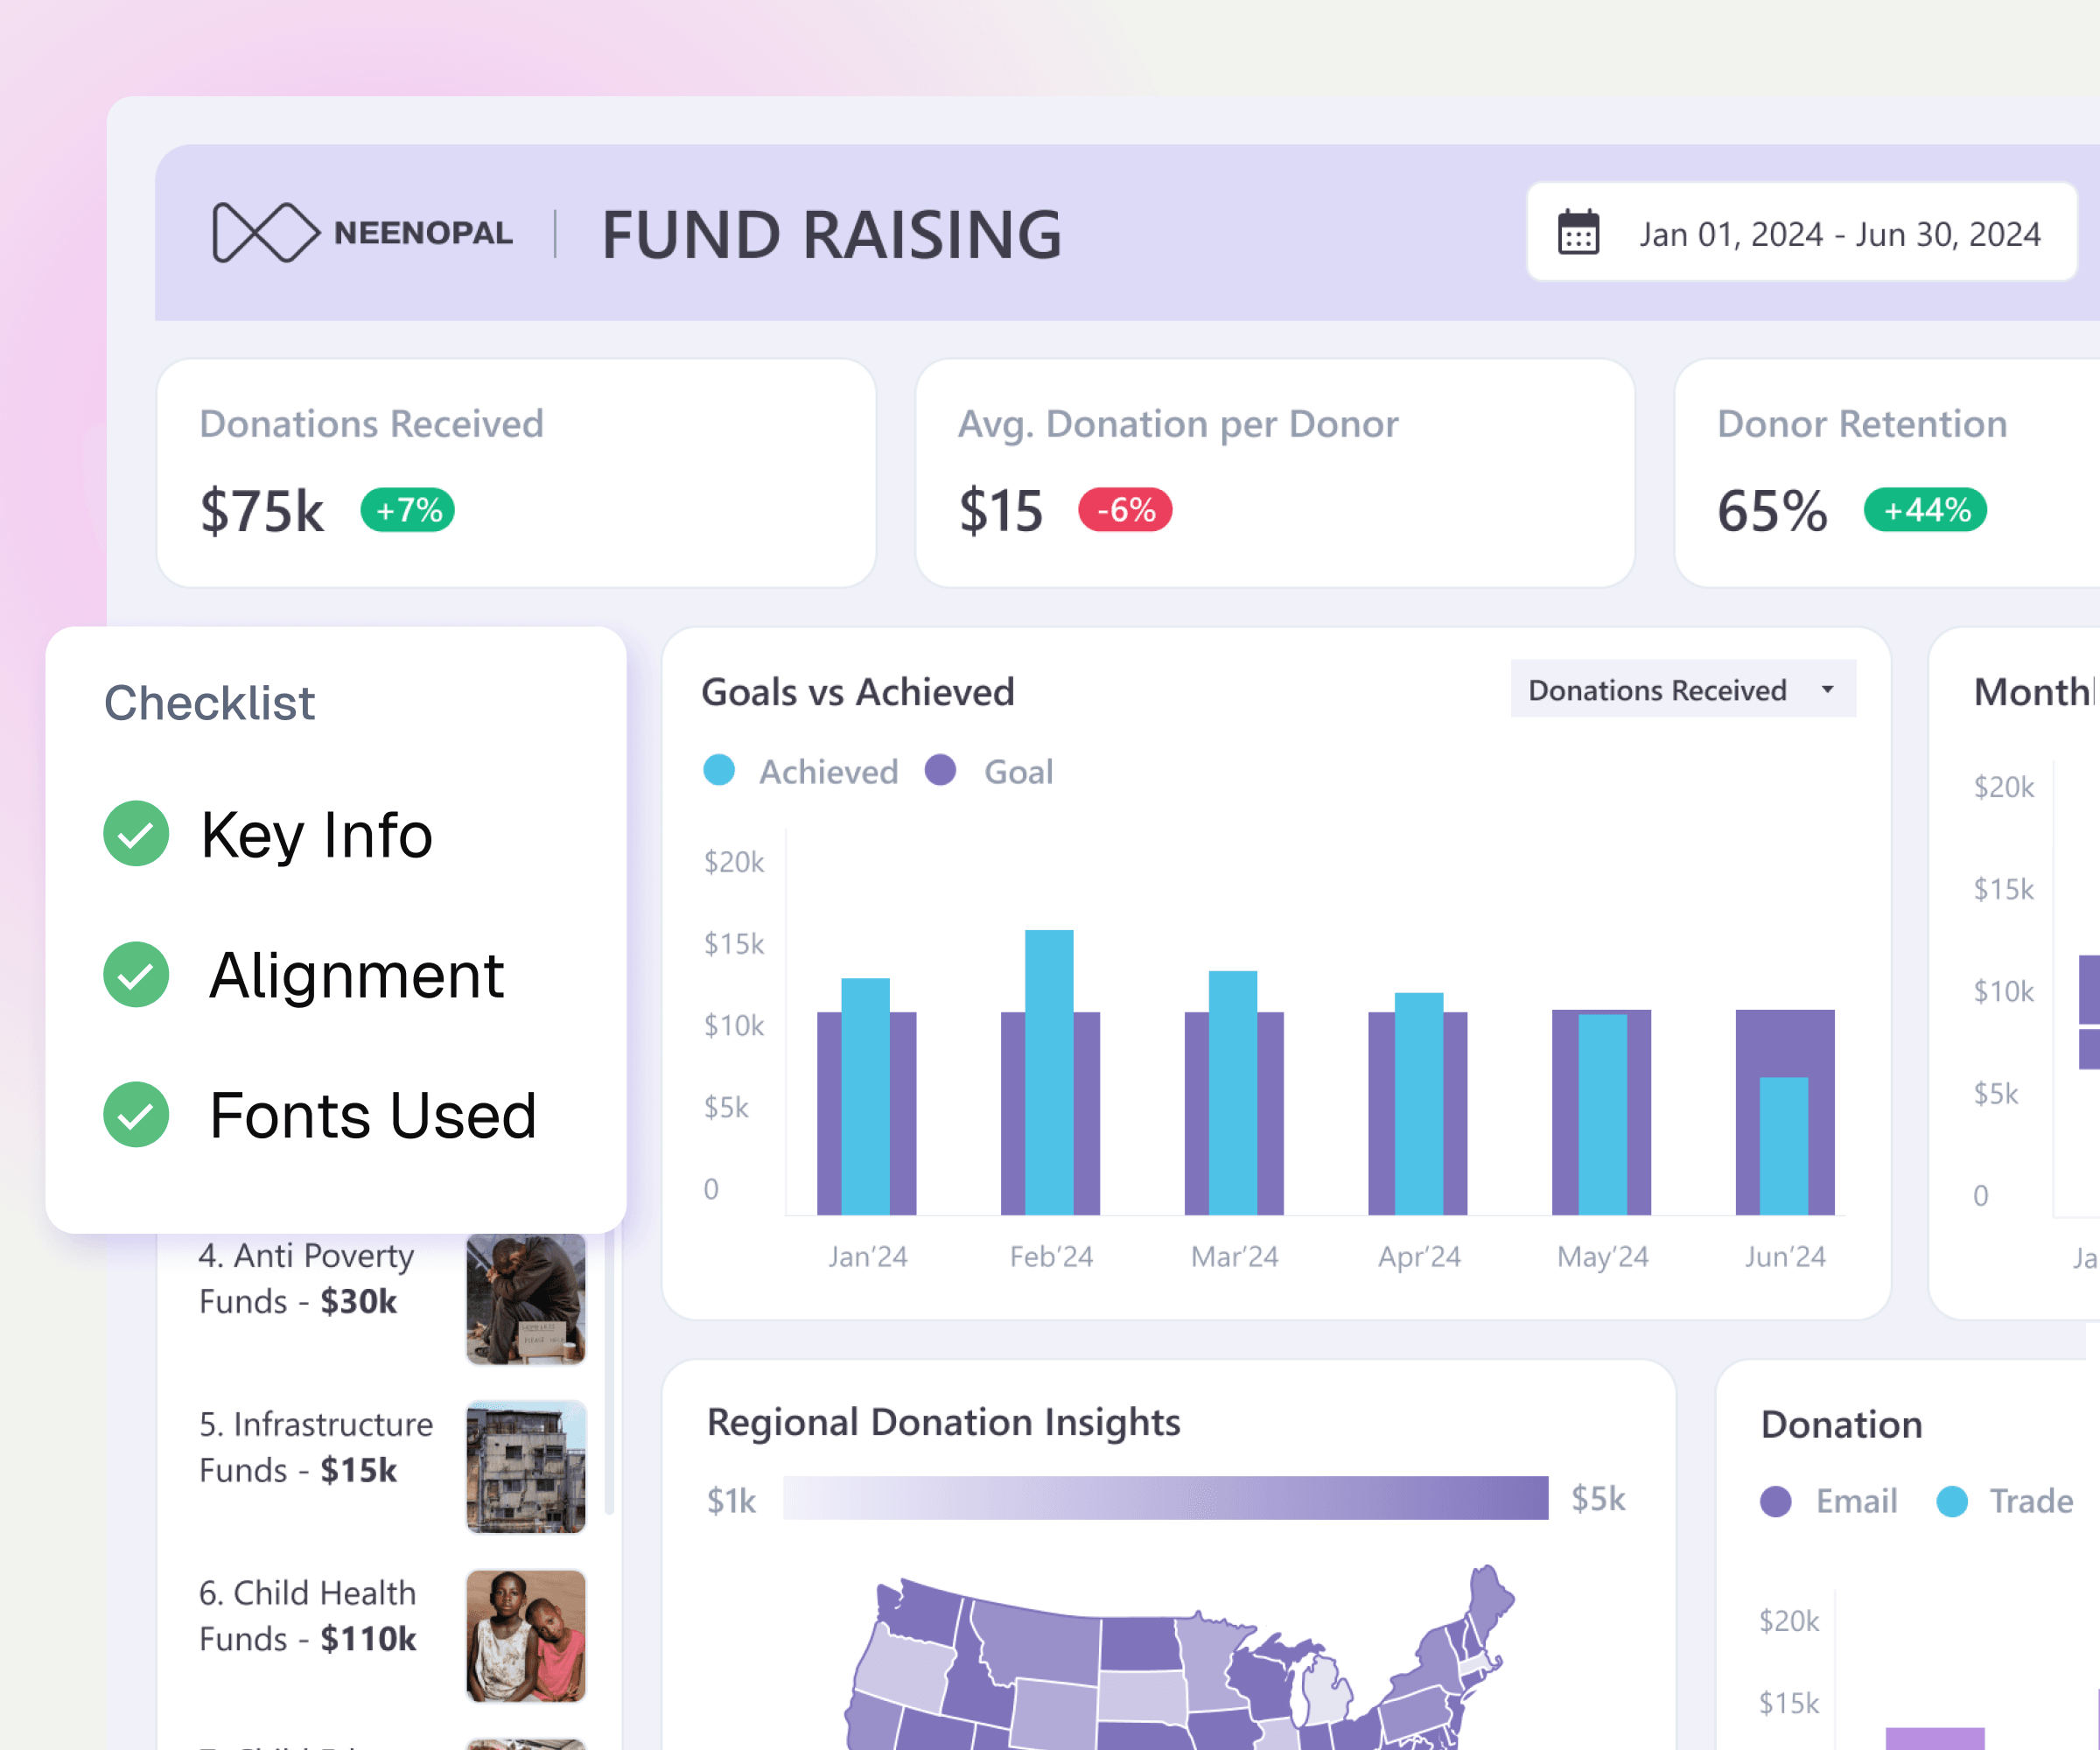
Grew design at a data and analytics company from one person to a 15-person function across design, UI and content.
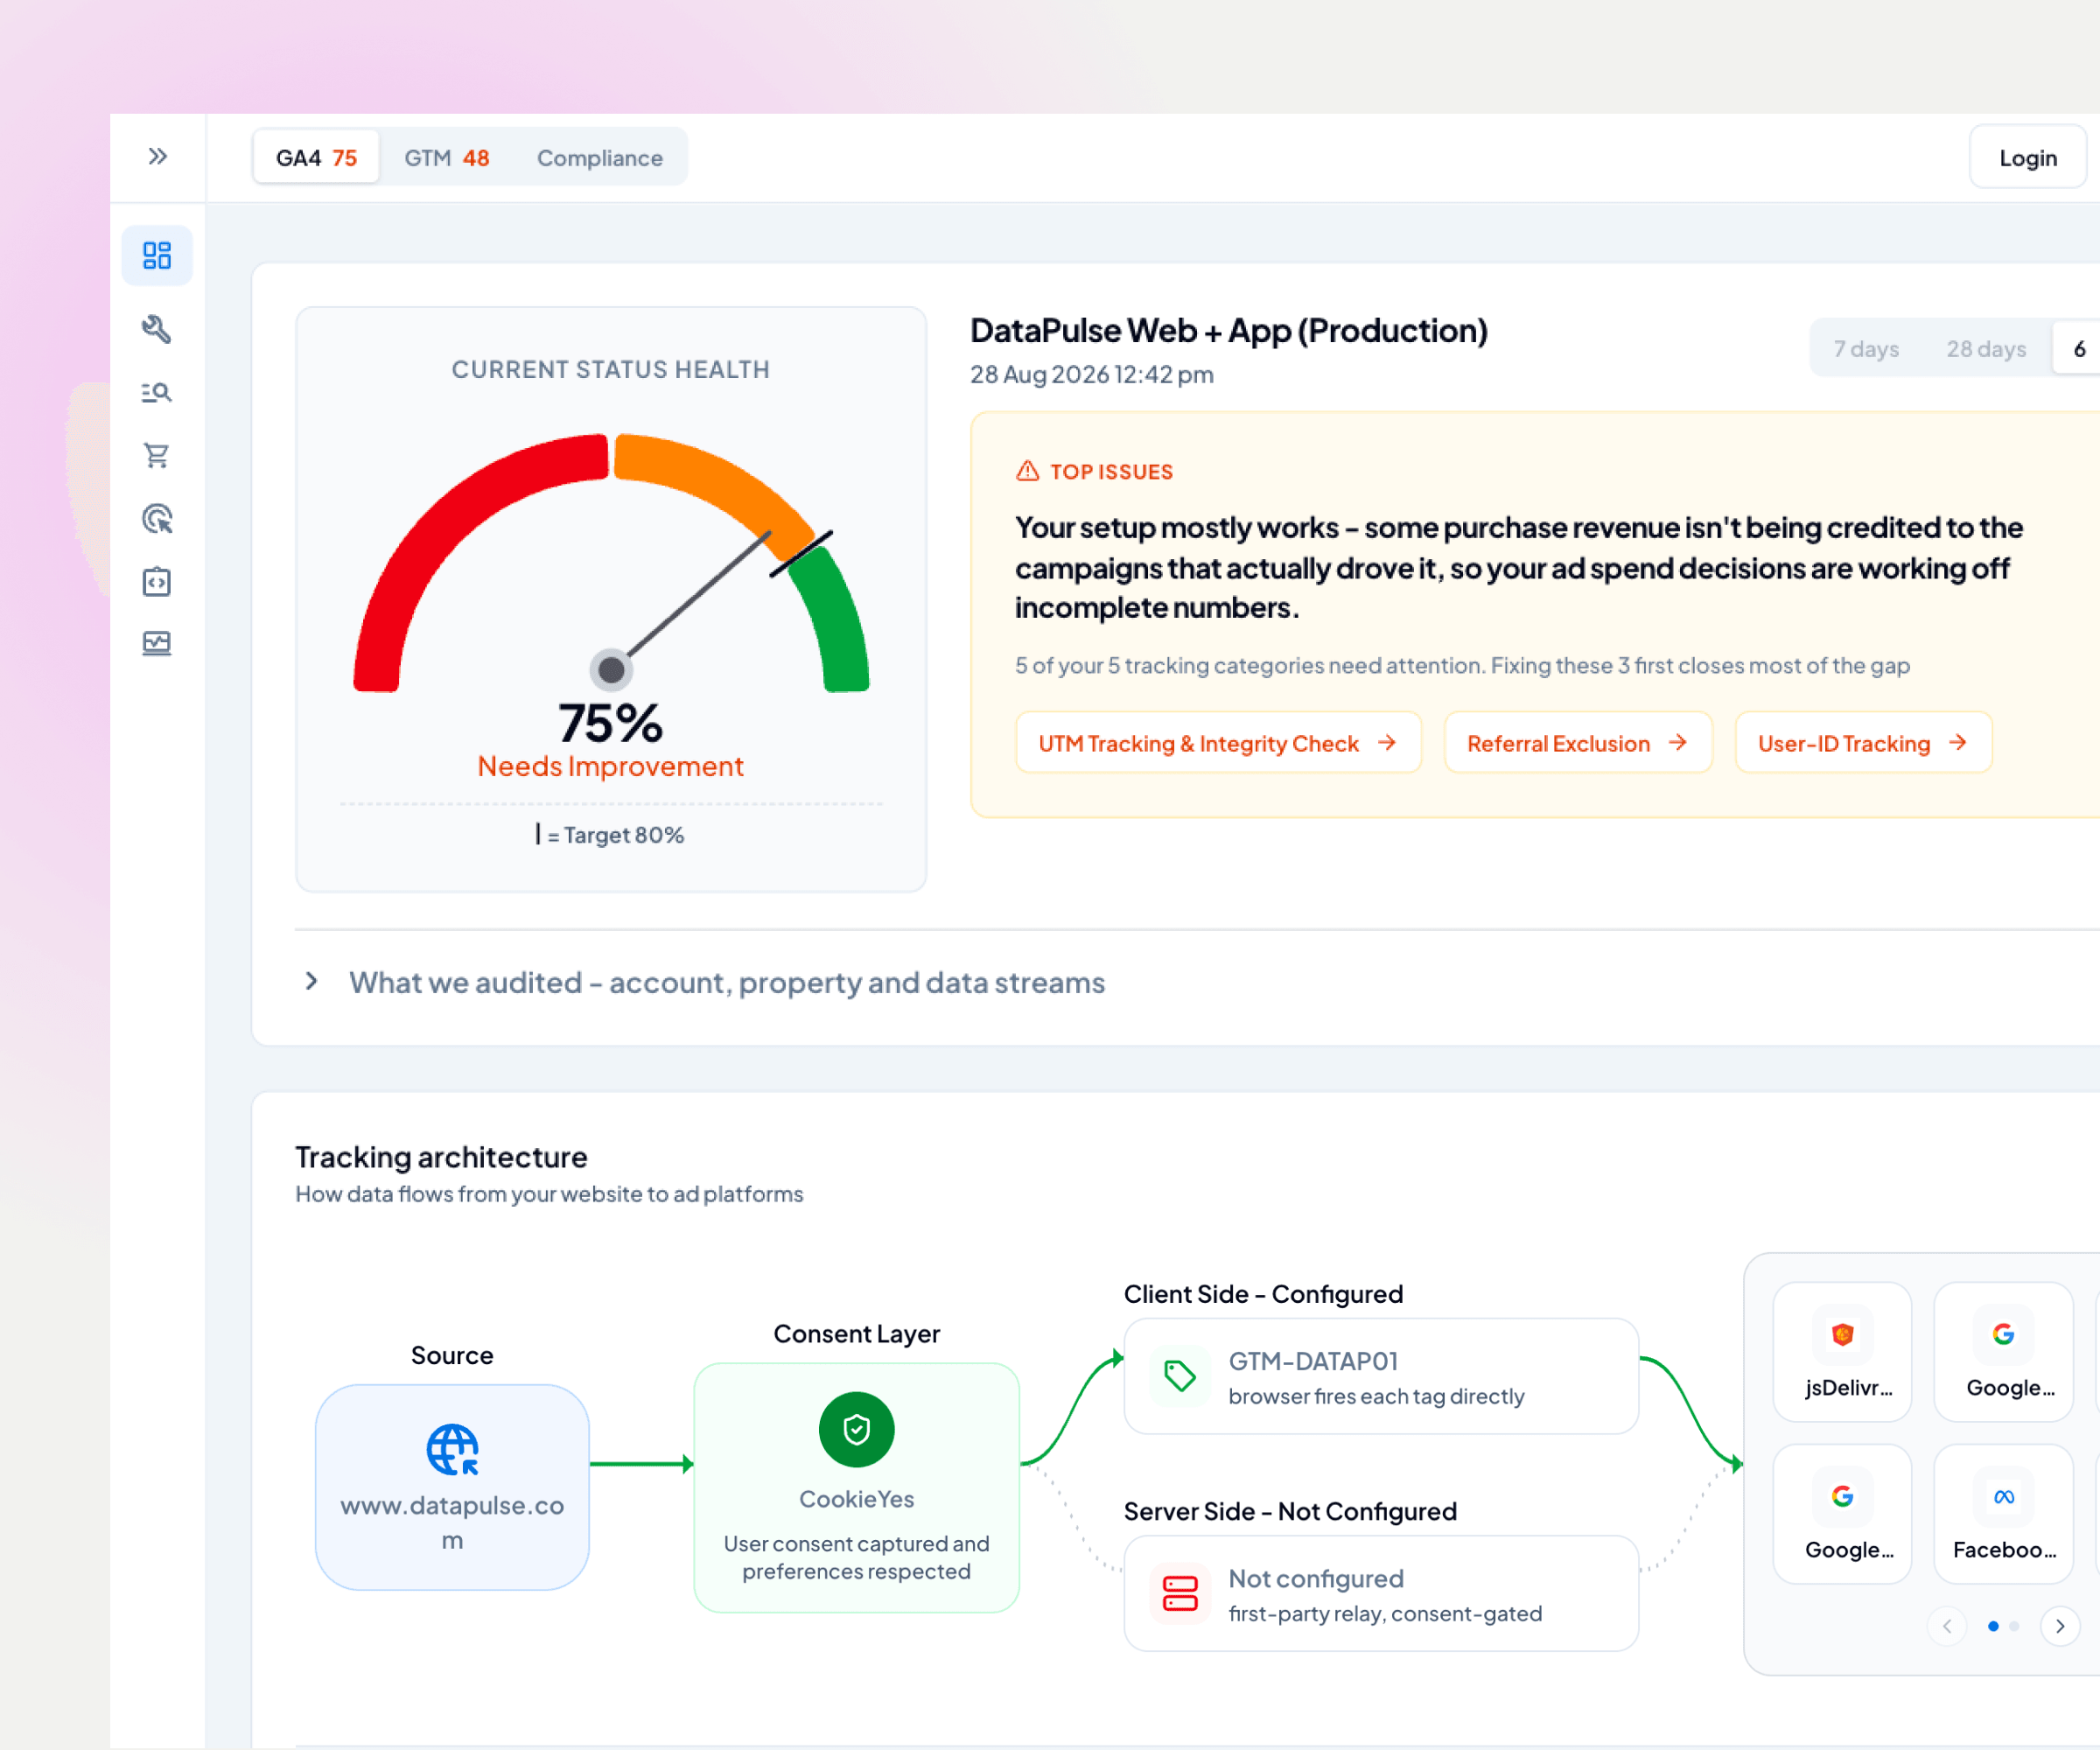
A Google Analytics audit for small businesses. We launched it, found our core assumption was wrong, and changed the product.
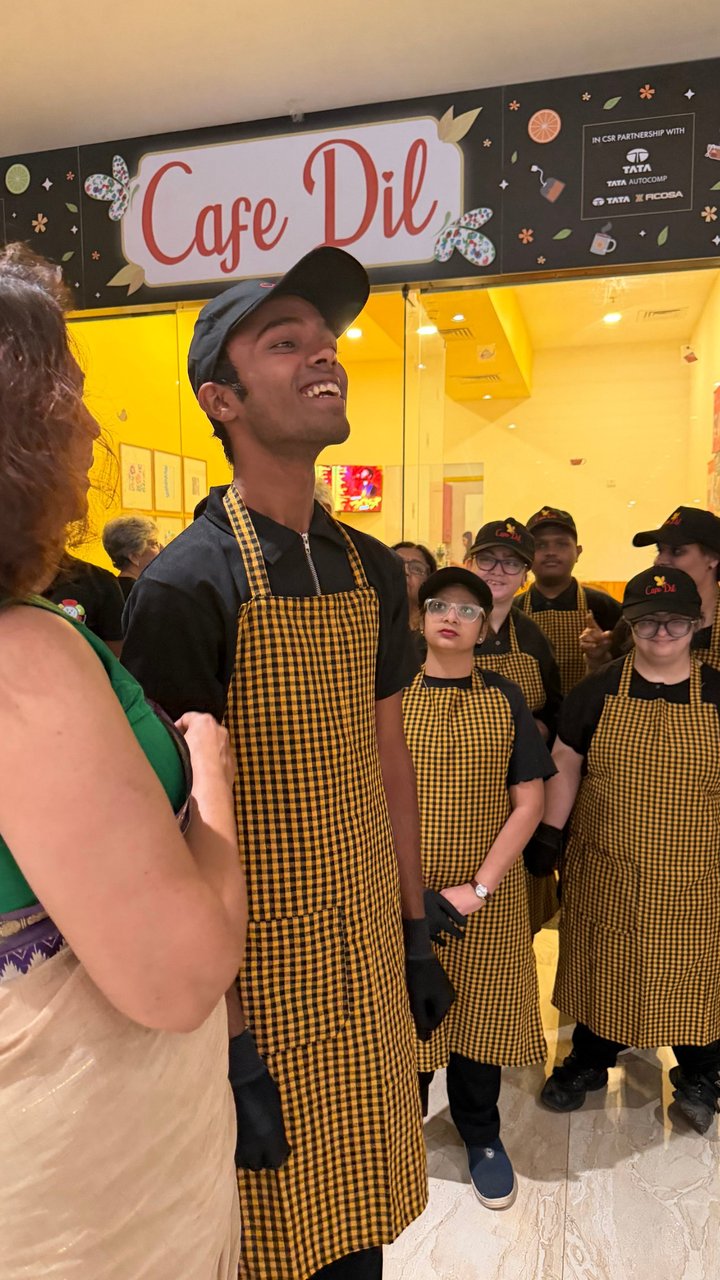
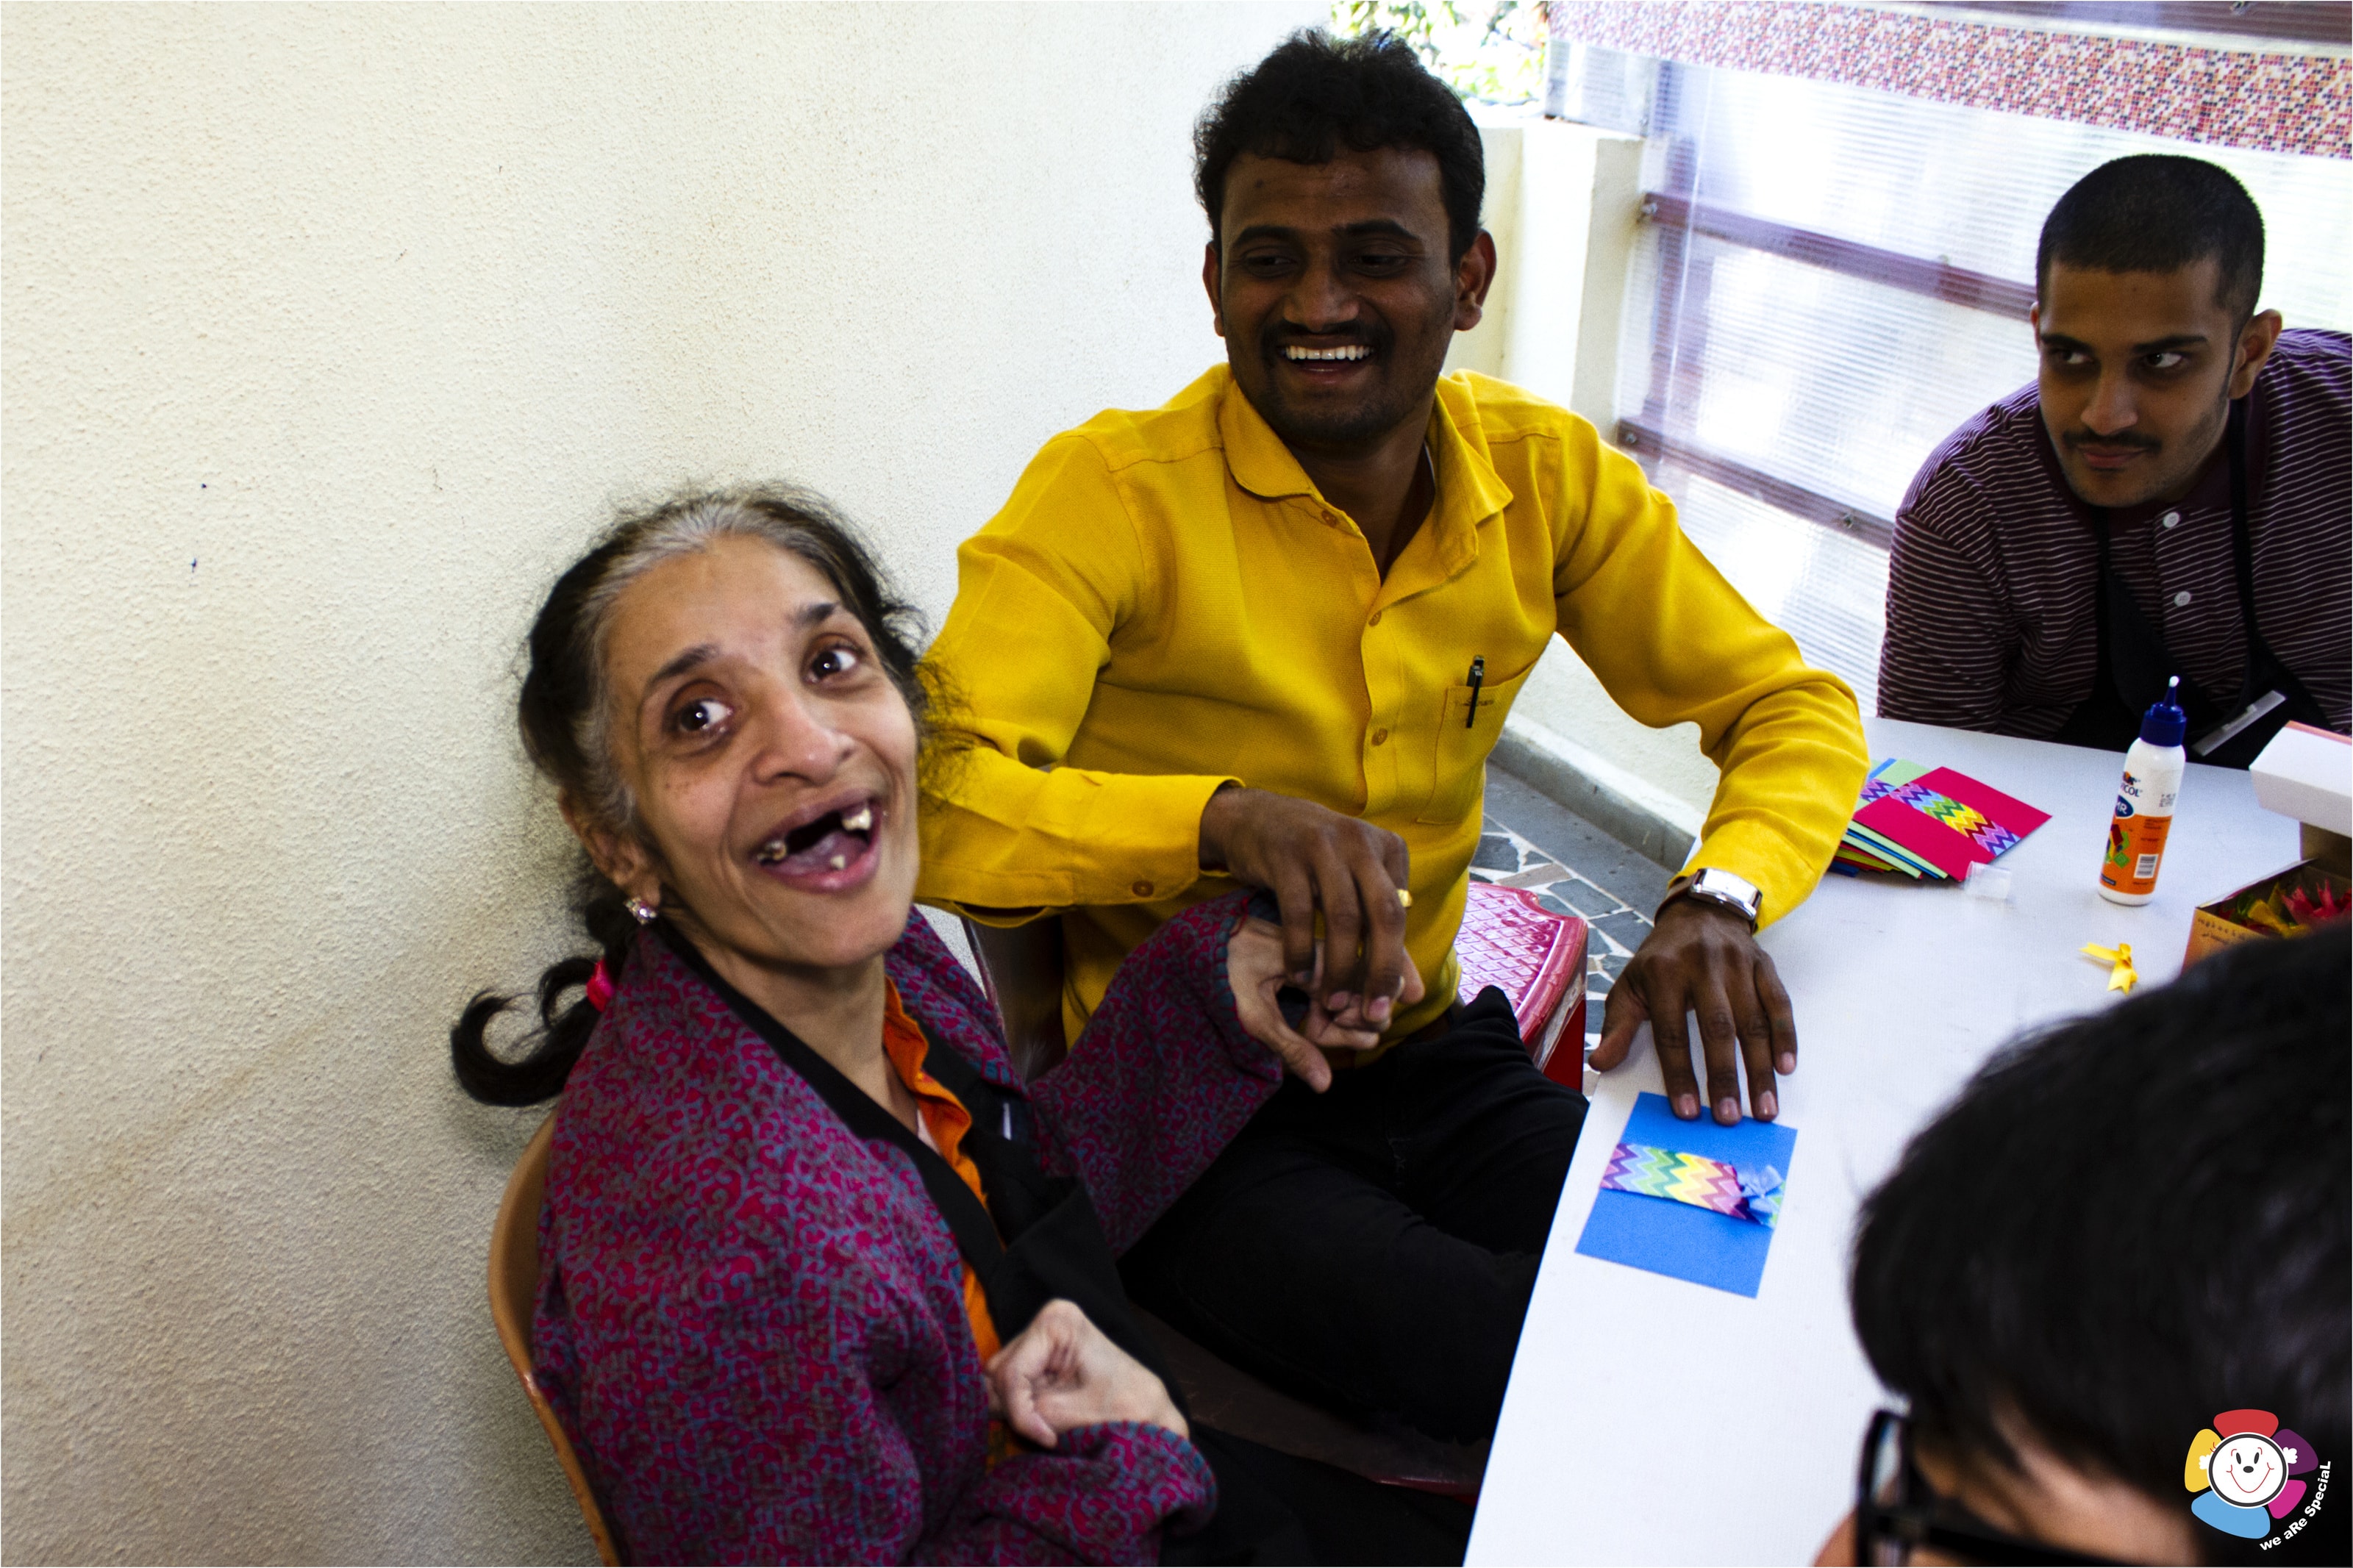
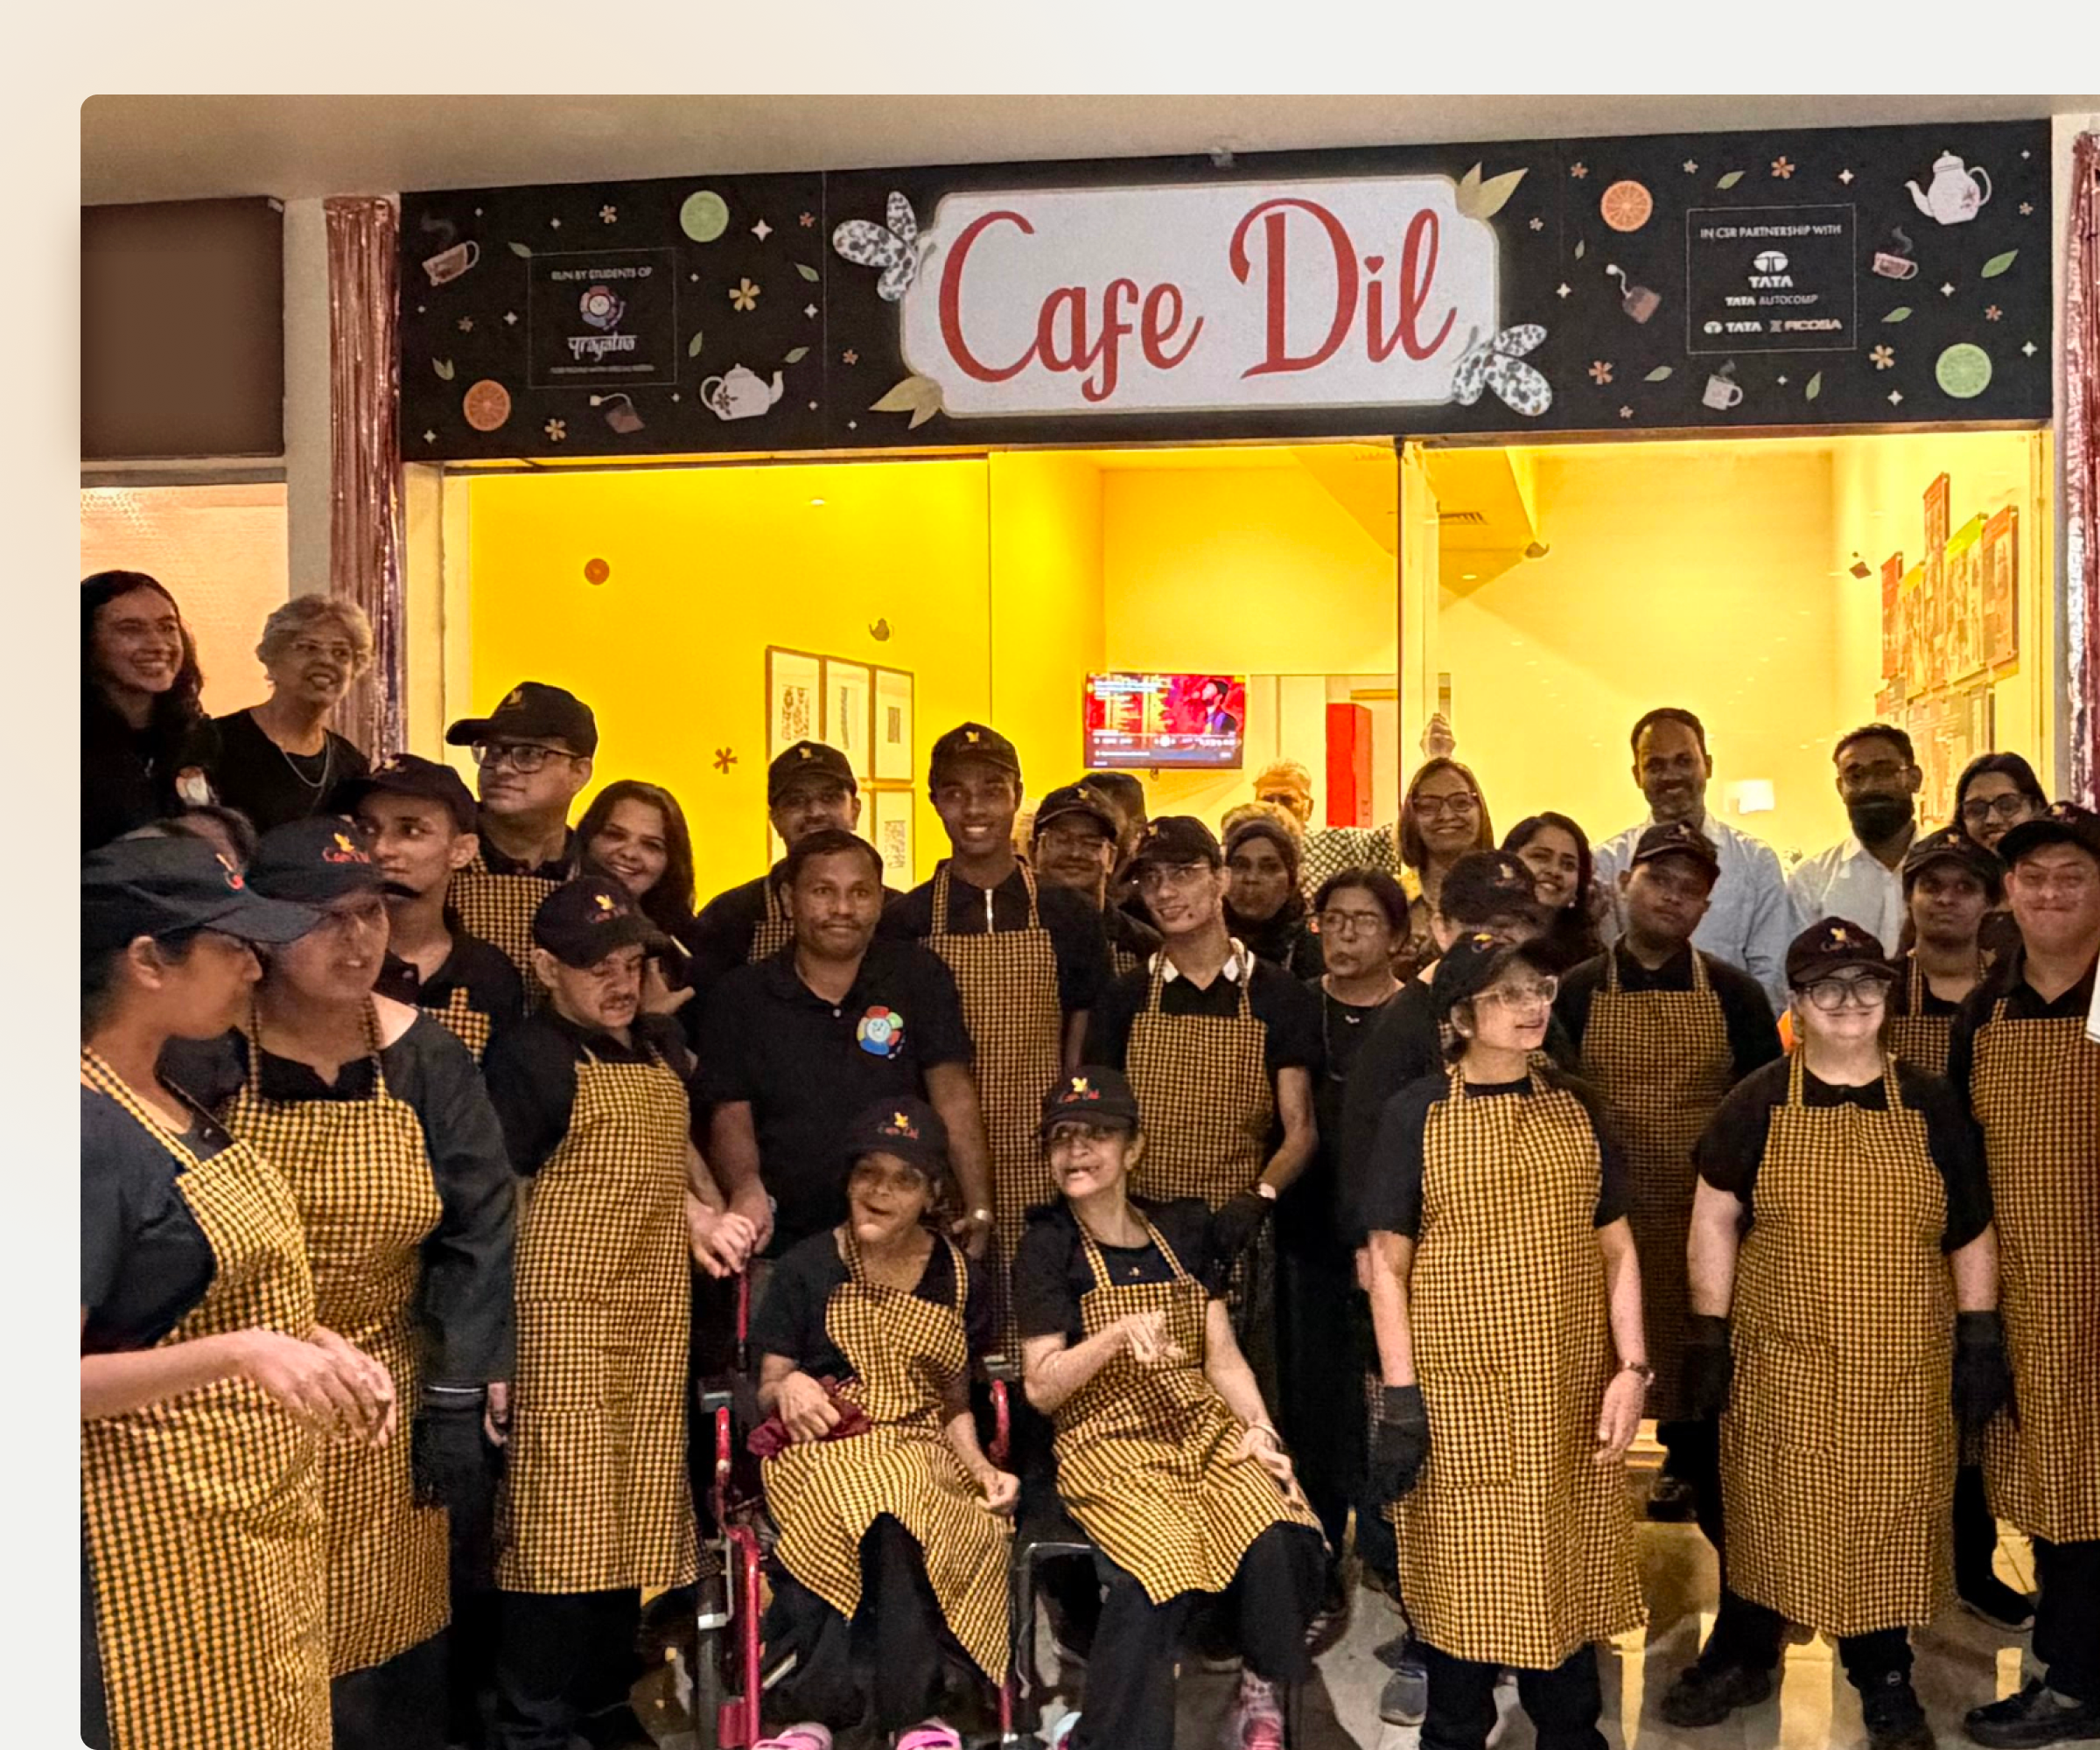
Built the identity and launch materials for Cafe Dil, including customer-facing menus and signage, and picture-based menu aids for the adults with disabilities running the cafe.
How I lead
Across my work, I've found that good leadership isn't about being involved in every decision. It's about giving people the context, tools, and confidence to make those decisions themselves.
Read how I leadI want my team to understand the thinking behind decisions, so they can make good ones on their own.
I believe good work happens when people feel trusted to make decisions, take ownership, and learn from each other.
I value how people approach problems and work through unfamiliar challenges just as much as what they already know.
I try not to get too attached to my first idea. If the evidence points in a different direction, I'm willing to rethink the approach.
In their words
Since she joined, Pinky has truly been the foundation of our design team. … What really stands out, though, is how she consistently brings fresh, innovative ideas to the table, not just on the design side, but from a data perspective as well.
With Pinky, I always felt safe. She had our back, so nothing weighed on us. I've seen what most managers are like, and Pinky is very different. Whichever team gets her will be really lucky.
As someone new to data visualization, her guidance and support were invaluable in helping me learn and grow. … I am grateful for all that she has taught me.
I have witnessed firsthand her remarkable sixth sense in creating designs that not only meet but exceed client expectations. … Pinky's work consistently transforms KPIs into tangible success stories.
Experience
Leading products and a design function inside a data company, after agency work and running my own studio.
Lead a multidisciplinary design function
NeenOpal
2020 – Present
Lead product direction and design
Mokkup.ai & GAfix.ai
2022 – Present
Ran a small design studio serving growing businesses
Media Room
2019 – 2020
Managed client communication design
Chameleo Design Consulting
2016 – 2019
Teaching
I run workshops that help people become better designers. I also talk publicly about designing with data and the products built around it.
All workshops & talksA public webinar on making dashboards that are aesthetically pleasing as well as clear.
What Mokkup was built for, what we're doing with it now, and where it's going.
An interview with NeenOpal's GA4 expert on why GAfix was built.
Photography samples, alongside films I've shot, directed and edited.
Open the gallery